Aviation contributes to global climate warming by being responsible for 2.5 to 2.6 % of the global carbon dioxide (CO2) emissions in 2018. However, CO2 is only partly responsible for the climatic effect of aviation. Further contributions to aviation-induced climate change stem from the by-products of fossil fuel combustion like nitrogen oxides (NOx) or sulphur dioxide (SO2). Currently, much effort is done to use alternative fuels, like hydrogen, to make aviation more environmentally friendly. However, burning fuels that contain hydrogen bonds, no matter whether of fossil or synthetic origin, will result in the emission of water vapour, which is contained in the exhaust. Subsequently, the exhaust water vapour can condense and lead to the formation of condensation trails, known as contrails. Such contrails are artificial, optically thin cirrus-like clouds that are known to have, on average, a net warming effect on global climate.
In the new study by Wolf et al., model simulations from ERA5 re-analysis provided by the European Centre for Medium-Range Weather Forecasts (ECMWF) and observations from the In-service Aircraft for a Global Observing System (IAGOS) were used to obtain climatologies of regions, where contrails are most likely to form and their relation to ambient conditions. The focus is on a region ranging from Eastern United States to central Europe.
Wolf et al. provides distributions of typical crossing distance through a contrail-prone area based on IAGOS measurements and ERA5 simulations of temperature and relative humidity. It was found that for IAGOS, 50 % of the crossings of persistent contrail regions are shorter than 9 km, while in ERA5 the median is 155 km.
Further, Wolf et al. assessed the morphology of persistent contrail formation regions in terms of size, orientation, major axis length, and aspect ratio of individual regions. Persistent contrail shape information might be relevant for economic decision making to re-route flights horizontally or vertically. Half of the persistent contrail regions are found to be smaller than 35000 km2 (at 200 hPa) and the median of the maximum dimension is shorter than 760 km (at 200 hPa). Furthermore, these regions tend to be of near-circular shape with a tendency to a slight oval shape and a preferred alignment along the dominant westerly flow.
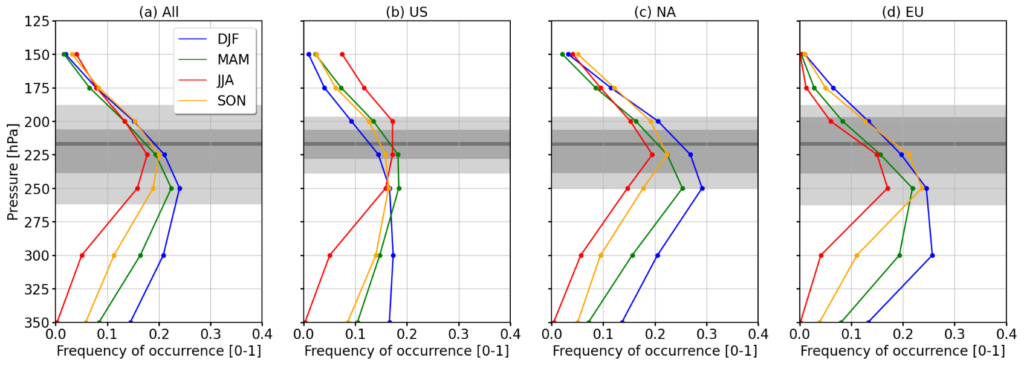
Seasonal, vertical distributions of the persistent contrail formation potential are information that could be used by airlines to assess the distance they would need to reroute on average. A seasonal overview is given in the figure below. The analysis provides a general perspective of the temporal and spatial distribution of these regions in ERA5. It shows that vertical distributions of persistent contrail formation are characterized by a maximum between 250 and 200 hPa. The horizontal distribution of these regions suggests that they are likely to appear in the same location on adjacent pressure levels.
Vertical distribution of persistent contrail formation potential P (unitless) for the (a) full domain, as well as (b) the US, (c) the North Atlantic Ocean, and (d) the European sub-domains, respectively. Colours represent winter (blue), spring (green), summer (red), and autumn (orange). IAGOS-based flight pressure distributions are indicated in grey giving the 10th, 25th, 50th, 75th, and 90th percentiles.
In addition to that, temperature, relative humidity and wind speed are studied to identify their effects on related persistent contrail formation. Persistent contrail formation is primarily limited by too warm conditions below and too dry conditions above the formation region. The distribution of persistent contrails is slanted towards lower altitudes from 30° N to 70° N, following lines of constant temperature and relative humidity. For an observed co-location of high wind speed and high persistent contrail formation, it remains unclear whether persistent contrail and the jet stream are favoured by the same meteorological conditions or if the jet stream itself favours persistent contrail occurrence. The analysis suggests that some persistent contrail regions will be difficult to avoid by rerouting aircraft due to their large vertical and horizontal extents.
Contrails are formed in the atmosphere by aircraft engine exhaust. Depending on the temperature and the humidity of the atmosphere, some contrails can persist and remain for several hours disturbing the Earth’s radiative budget. The latest studies have reported the overall impact of contrails to be warming but with uncertainties. Especially when we focus on contrail outbreaks, which is the main contributor to contrail induced radiative effects, their forcing exhibits variations in sign and magnitude and needs to be accurately quantified.
Xinyue Wang and her colleagues combined satellite data, weather data and air traffic data to detect two contrail cirrus outbreaks over Western Europe in clear sky conditions. Infrared images were used to identify and track contrails with a 15 min frequency. Then, cloud properties, which are retrieved from geostationary satellite observations, are used with a radiative transfer code to calculate the radiative forcing of these contrail-cirrus outbreaks. In this particular case, we can see that contrail cirrus show various signs of radiative forcing, resulting in alternative cooling and warming effects. During daylight hours, the cooling effect prevails, but there are also moments that longwave warming dominates especially over land surface. The absolute value of the radiative forcing in W/m2 is also very high. For comparison, the forcing of the CO2 since 1750 calculated by the IPCC is 1,5 W/m2, which is 10 to 15 times less than the maximum instantaneous radiative forcing that a contrail can have. The difference is the timescale: contrails have a very strong impact for a few hours, whereas CO2 remains in the atmosphere for centuries.
The animated images below represent contrails cirrus observed using satellite data. The left panel shows the dust RGB composited from infrared images. In the middle, wind data and the ice supersaturated area for contrail formation and persistence are superimposed. The right panel shows the calculated radiative forcing. The year, month, day and hour in UTC are shown in the title.
To lower the climate impact of aviation, contrail avoidance strategies such as aircraft rerouting are being investigated. The method used in this study to quantify the hourly radiative impact forcing of contrail outbreaks could be applied for verifying the climate benefits of these strategies.
The impact of condensation trails, known as contrails, formed behind aircraft is an important area of research for accurately accounting for the contribution to global warming made by the aviation sector. Among the factors influencing the formation and persistence of these contrails, the composition of the plume and the atmosphere is the subject of intense research, but the role played by aircraft wakes has received little attention.
A two-dimensional parametric study of the effects of stratification and the position of the engine jet along the span was therefore carried out to assess the potential radiative impact of early contrails. This phase is unusual in that its dynamics are purely two-dimensional. It plays a particular role in the vertical dispersion of contrails due to the combined effects of stratification and jet-vortex interaction. The model consists of two counter-rotating vortices and two engine exhaust plumes. It represents a cross-section of the aircraft wake during the vortex phase.
The interaction between the jet emitted by the engines causing the contrails and the aircraft wake leads to significant changes in the altitude of the contrail (of the order of several hundred metres). This change in altitude has consequences for the radiative impact of the contrails, since the associated change in temperature influences the ice content and radiative properties. This vortex entrainment is highly dependent on the relative positioning of the jet in relation to the marginal vortices at the wingtips. Jet dispersion is also strongly influenced by buoyancy forces associated with atmospheric stratification. Three main behaviours are observed. For low levels of stratification, the ice plume descends with the wake vortices, generating little optical impact. This impact is all the weaker the closer the jets are to the wingtip vortices. For high levels of stratification and close spacing between the jets, the ice plume tends to remain at the flight altitude and spread horizontally, generating a greater optical impact. Finally, for high values of stratification and jet spacing, the plume remains concentrated in the vortices at flight altitude, resulting in a low optical impact. A threshold effect was observed, which could make it possible to feed larger-scale, less well-resolved climate models. In particular, a jet located closer to the wing tip results in contrails located at lower altitudes and a reduced optical thickness, suggesting that the position of the jet could be an interesting way of attenuating the radiative impact of the contrails.
The article written by Olivier Boucher, Nicolas Bellouin, Hannah Clark, Edward Gryspeerdt and Julien Karadayi can be found at : https://www.mdpi.com/2226-4310/10/9/744
Better flight trajectories to reduce the climate impact of aviation
Optimising aircraft trajectories to minimise operational costs is very important for airlines. There are several parameters to take into account, and fuel consumption is one of them. However, flight paths are not totally optimal in terms of fuel consumption because of airspace restrictions, safety rules, weather and other operational constraints.
The Climaviation study presents two methods for optimising the cruise phase of flight by making the most of variations in wind at a given flight level and constant speed. The first method consists of rotating the sphere so that the shortest trajectory between the departure and arrival points is on the equator. This reprojection means that we don’t have to worry about the mathematical singularities at the poles, and the trajectory can be ‘sliced’ quite naturally into several 50 km segments. The first method, known as gradient descent, involves finding the latitude for each point so as to minimise the flight time in relation to the winds. The second method, inspired by the work of Zermelo, adjusts the flight direction locally on the basis of a set of trajectories with different initial conditions and selects the best trajectory passing through the arrival point.
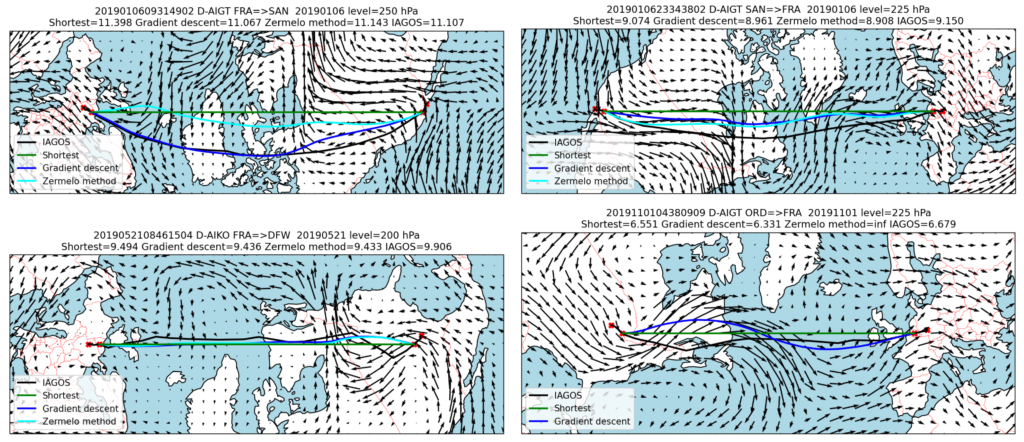
By comparing the trajectories optimised using these methods with the actual trajectories recorded as part of the IAGOS (In-Service Aircraft for a Global Observing System) programme, we find good agreement between the two methods. Furthermore, IAGOS trajectories are well optimised on certain routes, in particular transatlantic routes between Europe and North or South America, but they are less well optimised on other routes, in particular domestic routes in Asia or between Europe and Asia. This is probably due to airspace restrictions and narrow flight corridors that require detours.
Examples of optimised trajectories (cyan and dark blue curves) and the actual IAGOS trajectory (black curve) for transatlantic routes. The shortest route for the cruise segment is represented by a green straight line on the rotated sphere. The trajectories are read from left to right, with the airports and the start and end of the cruise indicated by red crosses. Some information is provided at the top of each panel: IAGOS flight ID, departure airport => arrival airport, flight code, date, cruise start date and end date, arrival airport, flight code, date, average pressure level in hPa, shortest flight time, fastest flight time (×2) and actual flight time in decimal hours.
A trajectory optimised for the wind will minimise fuel consumption and therefore CO2 emissions. However, if non-CO2 effects are also taken into account, the best trajectory may be different. In order to optimise trajectories that include the climatic impact of NOx and contrails, we need to ensure that we have chosen the right time horizon and the climatic cost associated with these effects, as well as the uncertainties of the models in predicting the zones that are most likely to see the formation and persistence of these contrails. This will be the subject of future work on contrail avoidance.
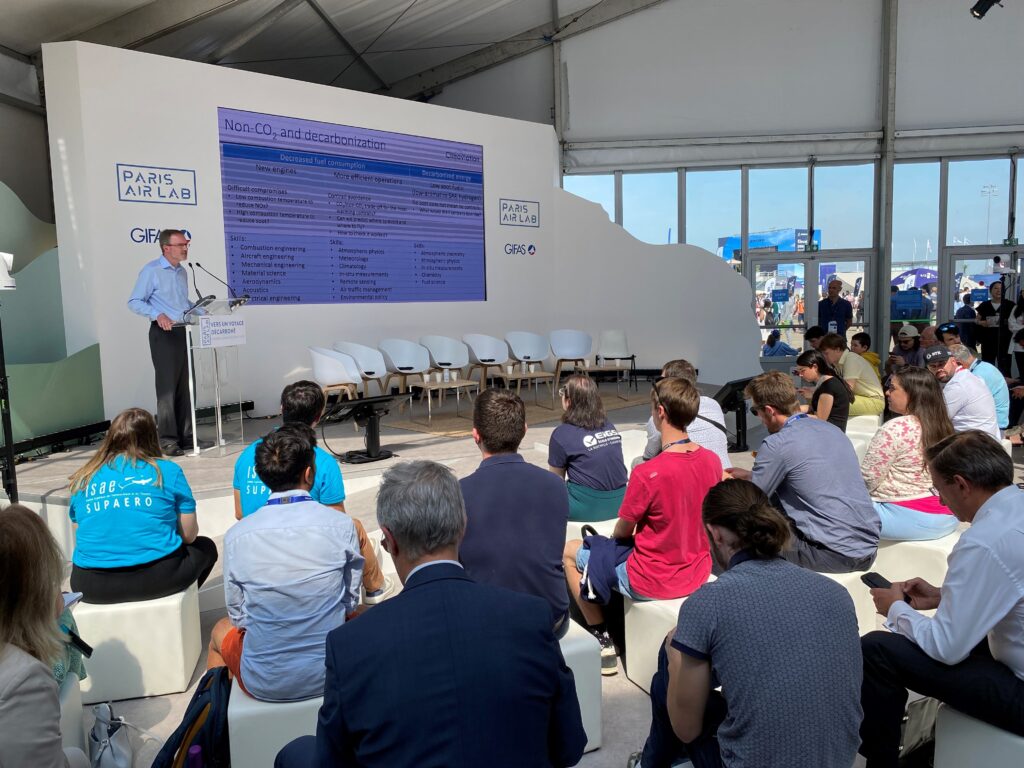
Nicolas Bellouin, director of Climaviation, was invited to present the total climate impact of aviation, with a presentation of the science of non-CO2 effects at the Paris Air Lab during the Paris Air Show in June 2023.
You can watch the presentation by clicking on the video below. The conference starts at the 57st minute.
Within the last one hundred years, air travel became a commodity and the number of flights increased each year. This comes with a cost and global aviation contributes to climate warming by multiple factors. The first factor that comes into one’s mind is CO2, with aviation being responsible for 2.5 to 2.6% of the total anthropogenic CO2 fossil fuel emissions in 2018 (Friedlingstein et al (2019), Lee et al (2021), Boucher et al (2021)). In addition to CO2, the combustion of fossil fuel in jet engines releases significant amounts of water vapor into the atmosphere.
The additional water vapor can form condensation trails, also termed contrails, that emerge behind aircraft (Schumann (1996), Kärcher (2018)). Most of the time these contrails vanish within a few seconds or minutes but they can be persistent up to a day depending on the environmental conditions (Jensen et al (1994), Schumann (1996), Haywood et al (2009)).
Whether a contrail can develop in the first place is usually estimated with the Schmidt-Appleman criterion (SAc; Schmidt (1941), Appleman (1953)). If the ambient air is moist and cold enough then the liquid water droplets in the exhaust plume freeze into ice crystals and form the contrail. For these artificial clouds to be persistent the ambient air must be additionally supersaturated with respect to ice in so called ice supersaturated regions (ISSR).
While contrails seem to be negligible, climate models and satellite observations suggest that contrails artificially increase the global cloud cover by 6 to 10% in northern hemisphere mid-latitudes with consequential effects on global climate (Burkhardt and Kärcher (2011), Quaas et al (2021)). Even though the exact magnitude depends on the ambient conditions, in most cases contrails heat the Earth atmosphere. Therefore, contrail formation should be avoided.
We analyzed an eight-year dataset of radiosonde (RS) observations launched from Trappes, France. The available RS profiles were flagged for their potential to host non-persistent contrails (NPC) and persistent contrails (PC). For this study we introduced a new, third category, labeled as “reservoir”, which does not fulfill the SAc but is nevertheless ice supersaturated. This reservoir provides an estimate for the potential spreading of existing contrails beyond the regions prone to NPC and PC formation.
An interesting and counter-intuitive fact: Making jet engines more efficient will generally increase the chance for contrail formation. The increased efficiency leads to a colder exhaust plume that contains the same amount of water vapor and, as a result, can form contrails at higher ambient temperature and more often. While more efficient engines emit less CO2 into the atmosphere, the higher frequency of contrails can contribute to climate warming.
Using the RS profiles from Trappes and separating for NPC, PC, and R situations, we found the highest frequency of occurrence for NPC that appear in up to 60% of all profiles during winter. Contrarily, a minimum is reached in summer. PC generally appear less frequent and are identified in 30 to 40% of the profiles throughout the entire year. The reservoir conditions are even rarer and found in approximately 20% of the profiles.
To estimate the actual occurrence of contrails we combined the information about the contrail formation potential with the actual flight traffic over Paris. The resulting profiles are still dominated by NPC, especially in winter and spring. For summer an increasing significance of PC is determined, as they overlap with the altitude of highest air traffic. The reservoir category occurs only in summer and autumn, and is negligible in other seasons.
To answer the question if flying at higher or lower altitudes to avoid contrails, today’s air traffic distribution is shifted. Increasing the flight altitude by 0.8 km reduces contrail formation in winter, while a reduction in flight altitude during summer is required to minimize potential contrail formation. Nevertheless, one has to keep in mind that aircraft already operate within their optimal altitude range and the maximum deviations towards lower or higher altitudes are limited by increasing air density and aerodynamic drag (lower boundary) as well as flying into the stratosphere (upper boundary).
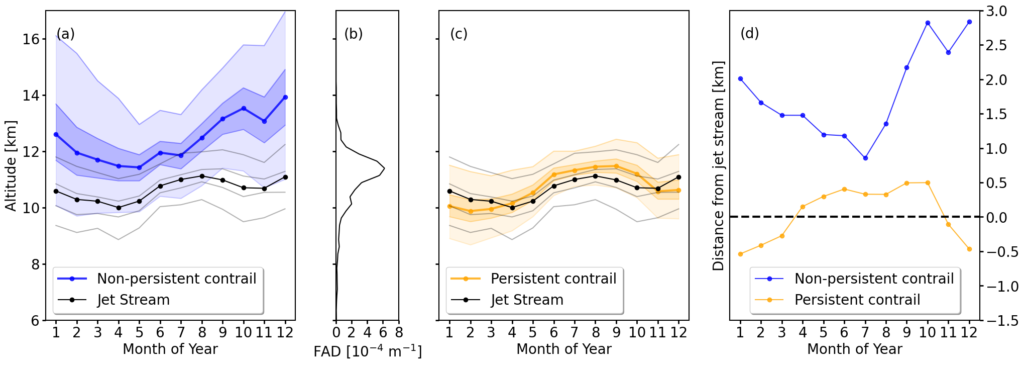
We further examined linkages of contrail formation with the thermal tropopause (TT) and the jet stream (strong persistent winds at around 10 km altitude in which aircraft tend to fly to save fuel). The median altitude of NPC is located at the TT (summer) and up to 1.5 km above the TT (winter). NPC are located between -2 km (winter) and -1 km below the TT (summer). With respect to the jet stream, the median altitude of NPC is 2 km (winter) and 1 km (summer) above the jet stream. PC are identified to be at the same altitude as the jet stream also following the inter-annual variation in jet stream location.
The figure shows that persistent contrails tend to appear close to the jet stream where aircraft usually want to fly whereas non-persistent contrails appear higher than the jet stream.
The aviation industry aims to become more environmentally friendly and started to develop new propulsion systems that use alternative fuels like ethanol, methane, or hydrogen. These fuels have other characteristics than today’s kerosene and, therefore, other thresholds for contrail formation. In the described study we assume that hydrogen is burned in engines that are comparable with today’s technology, rather than used in a fuel cell. Based on that we estimated the influence of these fuels on the likelihood of potential contrail formation. Switching to either of the alternative fuels leads to a general increase in potential contrails, particularly of NPC. The largest increase was found for hydrogen with an increase of 155% in summer. For PC the increase is less significant. Combining the minor increase in PC formation and the potentially CO2 – neutral hydrogen fuel, if produced with renewable energy, makes hydrogen powered aircraft an appealing solution.
We would like to guide the interested reader to the publication that is linked above and that contains all details of the study.
These “non-CO2” effects are related to nitrogen oxides (NOx), water vapour, and particulate matter – also known as aerosols when these particles are airborne – emitted during the combustion of paraffin by engines.
The non-CO₂ effects of aviation
NOx has no direct effect on the climate, but it does have an impact on ozone (which it helps to increase short-term concentration) and methane (which it helps to decrease medium-term concentration). Ozone (O3) and methane (CH4) are both greenhouse gases.
Under current conditions, it is commonly accepted that the warming effect of increased ozone due to aviation outweighs the cooling effect of decreased methane. The resulting effect depends not only on the amount of NOx emitted, which depends on the aircraft models, but also on the altitude, latitude and season of flight.
Water vapour emitted by aircraft is a greenhouse gas that tends to warm the climate when emitted at altitude. But, above all, it is the source of contrails when atmospheric conditions allow their formation – and the occasional transformation of these into cirrus clouds.
In the latter case, we speak of “contrail-induced cirrus clouds”; the ice that makes up the cirrus clouds would not have condensed without the passage of the aircraft or it would have done so only later.
Finally, the particles emitted by aircraft can modify the optical properties of the different types of clouds they encounter before being carried away by rain or deposited on the surface. These effects are, however, very complex and still very uncertain, so that even their warming or cooling character remains unknown.
Conversely, NOx, particles and water vapour disappear from the atmosphere after a few weeks if they are emitted at the cruising altitude of aircraft. The same applies to their induced effects on ozone or clouds.
On the other hand, the effects of NOx emitted by aviation on methane materialise on an intermediate time scale since the lifetime of methane in the atmosphere following a disturbance is 12 years.
Beyond the time scales associated with the lifetimes of chemical species, we must also consider those of the climate system itself. A disturbance of energy introduced into the climate system, even over a short period of time, has a lasting impact on the climate, as the ocean absorbs this additional energy before gradually releasing it back into the atmosphere.
The radiative forcing index is a bad idea for accounting for emissions
Climate change is usually measured by the concept of “radiative forcing”: this quantity measures the radiative imbalance of the planet due to past emissions and is expressed in relation to a reference period generally set at 1850, a time when industrial activities were still low.
For CO2, which has a long lifetime in the atmosphere, and to a lesser extent methane, this incorporates past emissions that have a lasting impact on atmospheric concentrations. For short-lived pollutants, only the most recent emissions matter, as the oldest emissions no longer exert a radiative forcing.
For the aviation sector, according to current knowledge, non-CO2 effects are responsible for a positive radiative forcing that tends to warm the climate. The ratio of total radiative forcing to the radiative forcing due to CO2 is called the Radiative Forcing Index (or RFI).
Some carbon footprint calculators use the RFI as a multiplicative factor of CO2 emissions to take into account non-CO2 effects and thus “convert” CO2 emissions into “CO2-equivalent”. However, we believe that this does not make much sense.
To convince ourselves of this, we can perform the following thought experiment: let’s assume that before the Covid-19 crisis, in 2019, non-CO2 effects are responsible for twice the radiative forcing of CO2, which corresponds to an RFI of 3 (i.e., (2 + 1)/1). One ton of CO2 emitted by aviation would therefore correspond to 3 tons of “CO2-equivalent”.
At the peak of the Covid-19 crisis in spring 2020, aviation activity was reduced by a factor of 4. CO2 emissions from aviation then fell drastically from their 2019 level, but this did not lead to a decrease in radiative forcing from CO2, as its concentration in the atmosphere continued to grow.
The radiative forcing from non-CO2 effects, on the contrary, decreased in line with the decrease in traffic (even by more than a factor of 4, as the methane effects of past emissions persist over time). During Covid-19, taking into account the same radiative forcing for CO2 – which increases only slightly from one year to the next – but a forcing divided by 4 for the “non-CO2” effects to take into account the reduction in traffic in 2020, we arrive at an RFI of 1.5 (i.e. (2/4 + 1)/1). One ton of CO2 emitted by aviation would therefore correspond to only 1.5 tons of CO2-equivalent instead of the 3 tons of CO2-equivalent before Covid.
This is nonsense because flights in spring 2020 will of course have the same climate impact as the same flights in spring 2019! So there is no reason why flights in 2020 should “count” half as much as those in 2019.
The fundamental reason why RFI is not appropriate as a multiplier is that radiative forcing accumulates the effects of past emissions, whereas we wish to compare the climate effects of current emissions, either to allocate an aviation user’s fair share of emissions, or to assess different technological or operational options that could be implemented in the future.
Which climate metric to use?
Fortunately, there are climate change metrics that can be used to estimate the future climate impact of a flight today, despite the short time scale of radiative forcing from non-CO2 effects.
In particular, the Global Warming Potential (GWP), which measures the radiative impact over a future period, typically 100 years, of emissions that occur at a point in time. The GWP of one kg of pollutant (such as CH4 or NOx) can then be compared with that of one kg of CO2, and the concept can easily be extended to aircraft trails.
Another metric, the Global Temperature change Potential (GTP), is defined in a similar way, but based on the change in average surface temperature at a certain time (50 or 100 years) after an emission pulse.
These metrics lead to much lower CO2 multiplication factors than the RFI unless time frames much shorter than 50 years are chosen. The choice of time frame is a political choice that can have important implications. A short time frame neglects the substantial part of the CO2 warming that occurs beyond the time frame. Choosing a long time frame may minimise the short-term effectiveness of warming reduction solutions based on non-CO2 effects.
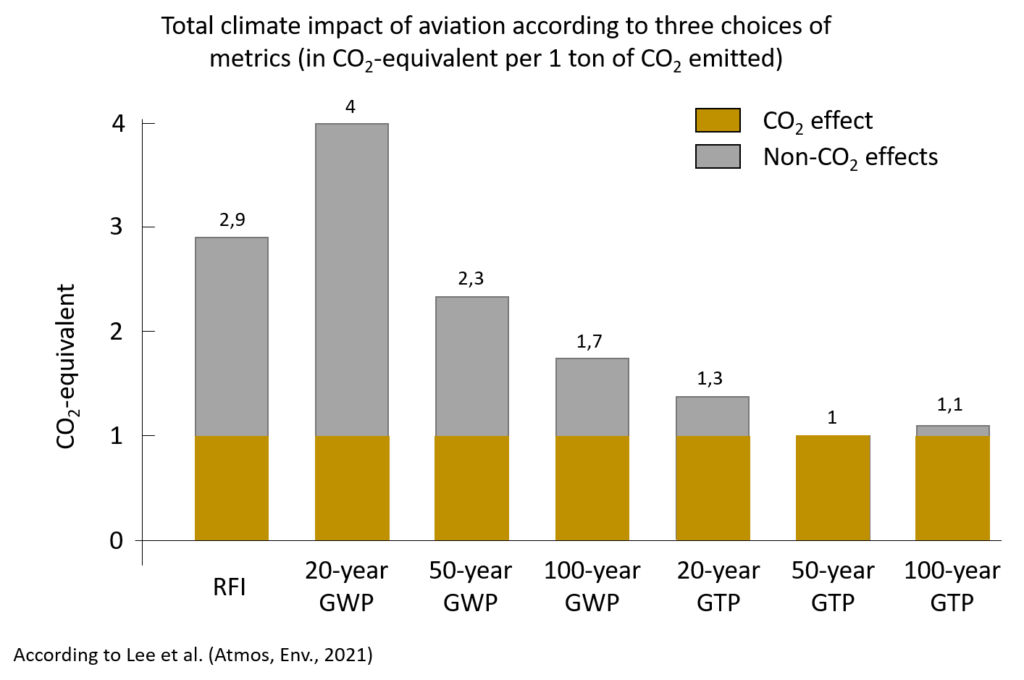
To illustrate the importance of the metric used to estimate the total climate impact of aviation or when calculating the carbon footprint, let us compare the RFI of aviation with the multiplicative factors associated with these other metrics.
According to a recent estimate, the various radiative forcings from aviation result in an RFI of 2.9. If the GWP at a time horizon of 100 years is used to calculate the equivalent emissions of the different aviation disturbances, a multiplication factor of 1.7 is derived. For the TMP with a time horizon of 100 years, the multiplication factor is only 1.1.
This shows that the choice of one metric rather than another is crucial for calculating the multiplication factor.
To illustrate the importance of the metric used to estimate the total climate impact of aviation or when calculating the carbon footprint, let us compare the RFI of aviation with the multiplicative factors associated with these other metrics. According to the recent estimate by Lee et al (2021), the various radiative forcings of aviation result in an RFI of 2.9. Using the GWP at a time horizon of 100 years to calculate the equivalent emissions of the different aviation disturbances, a multiplicative factor of 1.7 is derived. For the GTP with a time horizon of 100 years, the multiplication factor is only 1.1. This shows that the choice of one metric rather than another is crucial for calculating the multiplication factor.
A decision aid
Some of the solutions envisaged to reduce the climate impacts of aviation have the dual advantage of reducing both CO2 and non-CO2 effects.
In this case, the metrics simply serve to quantify the net gain for the climate. In contrast, other solutions require a trade-off between the CO2 and non-CO2 effects of aviation. For example, engine manufacturers know how to reduce NOx emissions but often at the expense of CO2 emissions. A partially or fully decarbonised fuel, such as hydrogen, could lead to greater non-CO2 effects.
Strategies for modifying aircraft trajectories to reduce the effects of contrails or NOx can also be envisaged, but at the cost of increased fuel consumption and therefore CO2 emissions. In these cases, it is relevant to compare the different effects (CO2 and non-CO2) with several adapted metrics to understand which effect prevails over the other and at what timescale (20, 50 and 100 years for example) and to be able to take the best possible decisions.
As far as we know, the non-CO2 effects of aviation have, on the whole, a warming effect on the climate. It is therefore relevant to try to reduce them in order to reduce the overall warming impact of aviation.
It is also important to ensure that the technologies being developed to decarbonise aviation do not induce excessive non-CO2 effects. Each solution must be examined and its impacts assessed using the most appropriate climate metrics, without forgetting to take into account other possible impacts (air quality, noise, biodiversity, etc.).
Climaviation, an innovative project to reduce the impact of aviation on the climate
Interview with Nicolas Bellouin, climatologist at the Institut Pierre-Simon Laplace, conducted by Sorbonne University.
The Climaviation project aims to better understand and quantify the climate impacts of aviation. It is led by Nicolas Bellouin, a climatologist in the United Kingdom and holder of the Aviation and Climate Chair at the Institut Pierre-Simon Laplace (IPSL). This contributor to the sixth IPCC report explains the objectives of this ambitious project, which brings together scientists from the IPSL and the French Aerospace Lab (ONERA).
In what context was the Climaviation project born?
Nicolas Bellouin: Faced with global warming and the need to reduce carbon dioxide (CO2) emissions, the aviation industry has embarked on a worldwide decarbonisation strategy. The task is particularly difficult for this economic sector where CO2 remains very present and where each innovation envisaged on aircraft must be tested and approved before being implemented.
In this context, the French Civil Aviation Authority (DGAC) has funded the Climaviation project over five years to explore different solutions to reduce the climate impact of aviation.
What is the objective of this project?
N. B.: Everyone knows that aviation emits CO2 and that these emissions must be reduced. But CO2 is not the only culprit. Aircraft engines emit other compounds: nitrogen oxides, water vapour and particles. Under the right conditions, water vapour and particles form contrails behind the aircraft. Some of these contrails persist and continue to expand, forming large fields of ice clouds that disrupt the Earth’s radiative balance. This is one of the so-called “non-CO2” effects of aviation.
According to recent climate modelling, the impact of these effects could be greater than that of CO2. But it remains uncertain because of the complexity of the mechanisms to be modelled and the scales to be taken into account in the simulations. Many questions arise concerning the size and properties of the cloud cover induced by contrails, their lifetime in the atmosphere, the formation and composition of ice crystals, the impact of a fuel change on the chemistry of the atmosphere, etc.
The aim of the Climaviation project is therefore to understand and quantify these effects in order to take them into account in climate impact reduction strategies.
What solutions are you exploring to reduce the climate impact of aviation?
N. B.: The aviation industry is intensifying its efforts to improve the efficiency of existing engines or to use alternative fuels with a low carbon footprint, or even new decarbonised energy carriers such as hydrogen.
We are also looking at alternative strategies that rely heavily on the existing fleet: changing flight altitudes, using updrafts, adjusting flight times, and so on. While these strategies do not necessarily require technological change, it is necessary to verify their effectiveness and measure their impact in the short and long term.
The DGAC therefore needs our scientific advice to determine which of these solutions not only reduce CO2 emissions but also limit non-CO2 effects.
This is a multidisciplinary research project combining the strengths of Sorbonne University and ONERA. How is this collaboration organised?
N. B.: This project brings together around thirty scientists. They include atmospheric physicists, cloud physicists, chemists, observers, specialists in automatic pattern detection, etc.
ONERA scientists know how to model the impact on the atmosphere of an engine or fuel change on a space-time scale of a few seconds and a few metres behind the aircraft. At IPSL, we model what happens on much larger scales: on a global level and over several hours, years or even centuries. Through our collaboration, we are trying to bridge the gap between these two orders of magnitude.
Our ambition is to connect ONERA’s models to the climate models developed by IPSL in order to build perennial scientific tools that can be used to estimate the climate impact of any new solution proposed in aviation.
Estimating how much of the CO2 radiative forcing can be attributed to the aviation sector may sound easy. Indeed CO2 emissions from aviation are well known; the rise in CO2 atmospheric concentration is well observed and the radiative impacts of CO2 are well understood and quantified. However, there are also a number of complicating factors: the CO2 radiative forcing depends logarithmically with the change in atmospheric concentration and the efficacy of natural sinks of CO2 is changing over time. .All these effects need to be accounted for if a proper attribution is to be made.
A popular method, used by Lee et al. (2021) and others, is the residual attribution method, whereby the radiative forcing for a particular sector (the aviation sector in this case) is calculated as the difference between the total CO2 radiative forcing and the CO2 radiative forcing should that particular sector had not existed. However this method suffers from a major drawback that was overlooked by previous authors. Since the CO2 radiative forcing is not linear in concentration, the total radiative forcing from all sectors considered together is not the same as the sum of the radiative forcings from each sector considered individually. Furthermore aviation is different from many other sectors in that it has occurred relatively late in the industrial period. It is thus essential to differentiate the impact of early and late emissions because they do not contribute equally to the current atmospheric concentration and radiative forcing. Aviation started only a few decades ago, its emissions can therefore contribute relatively more to the change in CO2 concentrations, but relatively less to the CO2 radiative forcing because of the logarithmic dependence.
Different methods exist to address those issues. In this study we used the proportional, differential, and time-sliced attribution methods. The last two methods require to compute the CO2 concentration at time t due to emissions from aviation and all anthropogenic activities up to a time t’ before time t. We have used the OSCAR compact Earth System model and historical CO2 emissions data to estimate the different values. This allows us to account for how the CO2 concentration decreases as natural sinks sequestrate the emitted CO2 over time.
We found that the more rigorous methods (the proportional, differential, time-sliced methods) lead to aviation CO2 radiative forcing 20%, 13%, and 12% larger than the marginal method which underestimates the true CO2 radiative forcing by aviation. However, this is compensated by the lower contribution to the increase in CO2 atmospheric concentration that we estimated using our well calibrated model. We estimate that aviation contributed 2.18 ppm to the rise in CO2 atmospheric concentration in 2018, which is less than the values of 2.9, 2.4 and 2.4 ppm found in a previous study relying on less sophisticated models. Our study thus provides a clear basis and methodology for future assessments of the aviation impact on the carbon cycle and CO2 radiative forcing.