The article written by Olivier Boucher, Nicolas Bellouin, Hannah Clark, Edward Gryspeerdt and Julien Karadayi can be found at :
https://www.mdpi.com/2226-4310/10/9/744
Better flight trajectories to reduce the climate impact of aviation
Optimising aircraft trajectories to minimise operational costs is very important for airlines. There are several parameters to take into account, and fuel consumption is one of them. However, flight paths are not totally optimal in terms of fuel consumption because of airspace restrictions, safety rules, weather and other operational constraints.
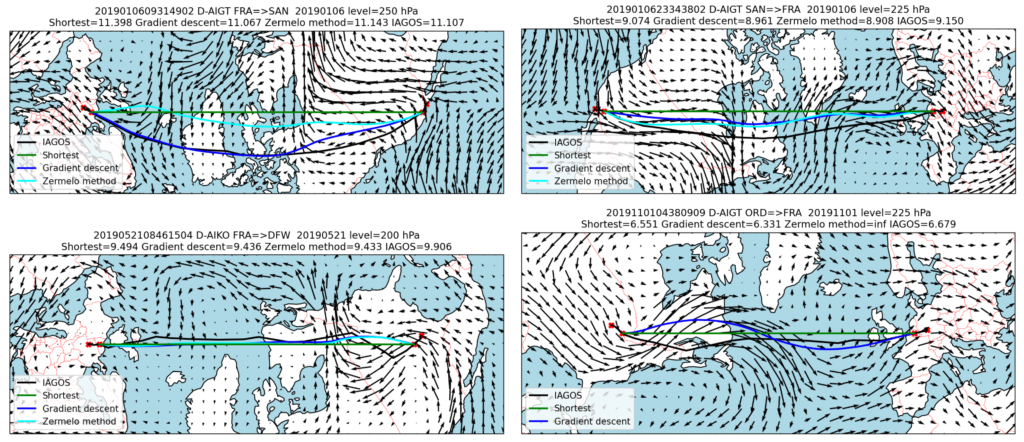
The Climaviation study presents two methods for optimising the cruise phase of flight by making the most of variations in wind at a given flight level and constant speed. The first method consists of rotating the sphere so that the shortest trajectory between the departure and arrival points is on the equator. This reprojection means that we don’t have to worry about the mathematical singularities at the poles, and the trajectory can be ‘sliced’ quite naturally into several 50 km segments. The first method, known as gradient descent, involves finding the latitude for each point so as to minimise the flight time in relation to the winds. The second method, inspired by the work of Zermelo, adjusts the flight direction locally on the basis of a set of trajectories with different initial conditions and selects the best trajectory passing through the arrival point.
By comparing the trajectories optimised using these methods with the actual trajectories recorded as part of the IAGOS (In-Service Aircraft for a Global Observing System) programme, we find good agreement between the two methods. Furthermore, IAGOS trajectories are well optimised on certain routes, in particular transatlantic routes between Europe and North or South America, but they are less well optimised on other routes, in particular domestic routes in Asia or between Europe and Asia. This is probably due to airspace restrictions and narrow flight corridors that require detours.
A trajectory optimised for the wind will minimise fuel consumption and therefore CO2 emissions. However, if non-CO2 effects are also taken into account, the best trajectory may be different. In order to optimise trajectories that include the climatic impact of NOx and contrails, we need to ensure that we have chosen the right time horizon and the climatic cost associated with these effects, as well as the uncertainties of the models in predicting the zones that are most likely to see the formation and persistence of these contrails. This will be the subject of future work on contrail avoidance.